Setting and Data
Setting
Data were taken from the BRISK-FL study- a randomised phase III study to compare the overall survival of brivanib versus sorafenib in patients with advanced HCC (aHCC). Patients were recruited from across Asia, Europe, America, Australia and Africa.
Estimand
Patients
Patients were eligible if they had not received any prior systemic therapy for aHCC and had a Child-Pugh A liver function score. Patients had to have an Eastern Cooperative Oncology Group (ECOG) Score of 0 or 1 and at least one untreated measurable lesion by computed tomography or magnetic resonance imaging. Patients with any prior use of systemic anticancer chemotherapy, immunotherapy or targeted agents for HCC (except for sorafenib) were excluded.
Intervention
Patients received brivanib as 800mg orally every day.
Outcome
The outcome is progression free survival (PFS) which is defined as the point from randomisation until radiographic disease progression.
Data
The dataset consisted of 480 patients. 323 (67%) patients had observed an event (died) and 157 (33%) did not have an observed event.
Model covariates
The covariates selected for inclusion in the model were Child-Pugh score Creatinine, Portal Vein and Extrahepatic spread (EHS).
| Covariate | N = 480 |
|---|---|
| Child-Pugh Score | |
| 5 | 310 (65%) |
| 5+ | 79 (67,97) |
| Creatinine | 79 (0.36) |
| Portal Vein | |
| None | 316 (66%) |
| Branch | 81 (17%) |
| IVC/Main | 83 (17%) |
| Extra-hepatic Spread | 176 (37%) |
| Positive | 176 (36%) | Negative | 304 (63%) |
Model covariates
Details of the covariates used to generate the model are: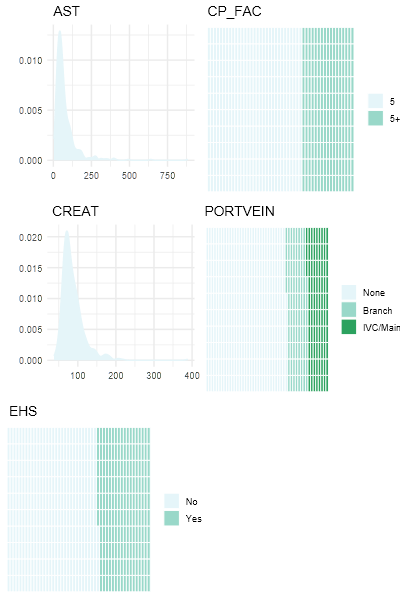
Model
The model constructed was a flexible parametric survival model using a spline function to model the underlying cumulative hazard function. Four internal knots were chosen and were placed at the timepoints 3, 6 12, and 24 months.
Model Construction
The model was contructed using a backward stepwise procedure using Akaikes Information Criterion (AIC) backwards stepwise procedure based on model AIC.
Model Fit
Some text to describe what is provided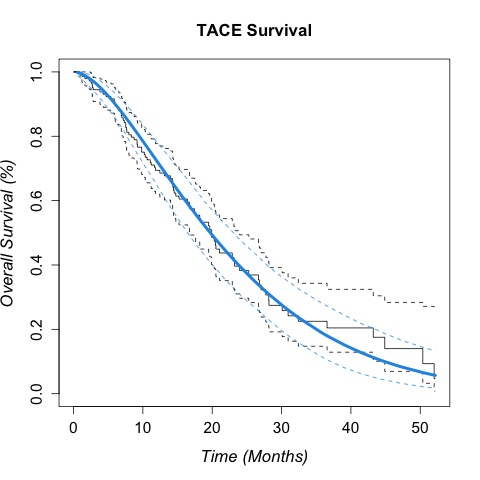
Model Estimates and Standard Errors
| Est (se) | HR (95% CI) | |
|---|---|---|
| γ0 | -3.75 (0.26) | 0.02 (0.014 - 0.039) |
| γ1 | 2.71 (0.48) | 15.06 (5.888 - 38.541) |
| γ2 | 0.21 (0.18) | 1.23 (0.864 - 1.747) |
| γ3 | -0.18 (0.35) | 0.83 (0.418 - 1.665) |
| γ4 | -0.16 (0.44) | 0.86 (0.358 - 2.046) |
| γ5 | 0.65 (0.6) | 1.92 (0.591 - 6.272) |
| Aspartate aminotransferase | 0 (0) | 1 (1.002 - 1.003) |
| Child-Pugh 5+ | 0.55 (0.12) | 1.74 (1.377 - 2.195) |
| Creatinine | 0 (0) | 1 (1.001 - 1.007) |
| Portal Vein Branch | -0.26 (0.16) | 0.77 (0.563 - 1.056) |
| Portal Vein IVC/Main | 0.08 (0.15) | 1.08 (0.806 - 1.446) |
| Extrahepatic spread Pos | 0.2 (0.12) | 1.22 (0.967 - 1.535) |
Model Prediction
See how this model can be used to predict survival!
Validation
Details on the validation of the model:
Validation Details
Validation are reported in term of Calibration, Discrimination and Somers' D.
Calibration is reported in terms of the Mallows C-Statistic and by regressing
the fitted linear predictor against the outcome (Slope). The linear predictor is
derived using the model's coefficients.
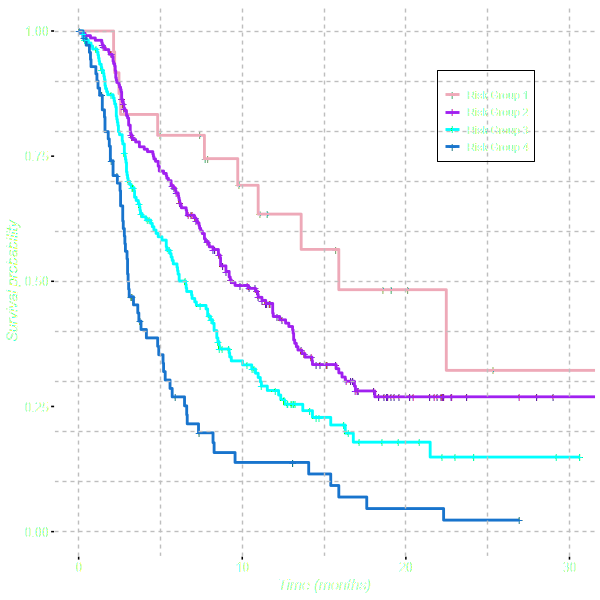
Discrimination is evaluated by categorising patients into 4 risk groups.
Risk groups are generated by using the 5th, 50th and 85th centiles of the
linear predictor. The risk groups are compared graphically
and the relative risk is evaluated by fitting a
univariable Cox Proportional Hazards Model.
Calibration
| est (se) | |
|---|---|
| C-Statistic | 0.61 (0.016) |
| Slope | 1.01 (0.14) |
| Somers' D | 0.22 |
Discrimination
| Est (se) | HR (95% CI) | |
|---|---|---|
| Risk group 1 | ||
| Risk group 2 | 0.43 (0.3) | 1.54 (0.85-2.79) |
| Risk group 3 | 0.84 (0.31) | 2.33 (1.28-4.24) |
| Risk group 4 | 1.46 (0.32) | 4.32 (1.91-4.15) |