
Setting and Data
Setting
Data were taken from the European Study group for PAncreatic Cancer (ESPAC) 3 Study - A randomised phase III study to investigate the role of chemotherapy in patients following surgery for Pancreatic Ductal Adenocarcinoma. Patients were randomised post surgery. Patients were recruited from 159 pancreatic cancer centers in Europe, Australasia, Japan, and Canada
Estimand
Eligibility criteria
Patients were eligible if they had undergone complete macroscopic (R0 or R1) resection for ductal adenocarcinoma of the pancreas with histological confirmation and with no evidence of malignant ascites, peritoneal metastasis, or spread to the liver or other distant abdominal or extra-abdominal organs. Patients had to be fully recovered from the operation, with a World Health Organization (WHO) performance score of 2 or lower and a life expectancy of more than 3 months.
Exclusion criteria
Patients with previous use of neoadjuvant chemotherapy or other concomitant chemotherapy and with pancreatic lymphoma, macroscopically remaining tumor (R2 resection), or TNM stage IVb disease were excluded.Intervention
Patients received gemcitabine as 1000 mg/m2 intravenous infusion once a week for 3 of every 4 weeks for up to 6 months
Outcome
The outcome is Overall Survival measured as the point from randomisation until death by any cause
Inter-current Events
The chosen estimand for analysis follows the Treatment Policy approach, ignoring any intercurrent events or termination of therapies as is suitable for evaluating patients at the point of treatment choice. Lastly, as a key prognositc indicator, only patients with a basleine measure of post-operative CA19-9 were retained in the model.
Data
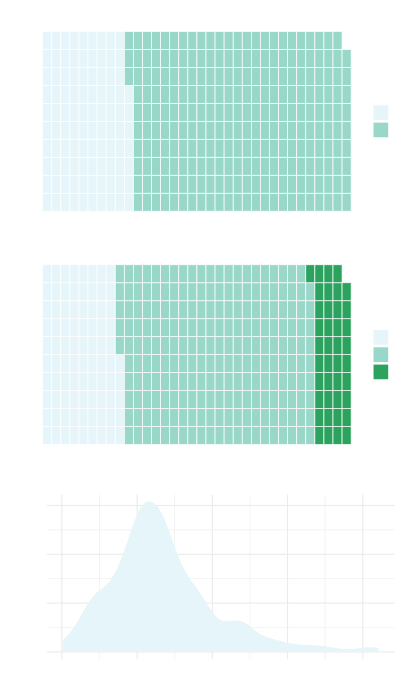
Data considered for inclusion in the model were observed from the baseline case report forms of the ESPAC-3 study and included Resection Margin Status, Lymph Nodes, Local Invasion, WHO status, Tumor Grade (Differentiation), Tumour Size, Diabetes status and Post-operative CA19.9
The dataset included 339 patients of whom 267 (79%) observed an event (died). Median Overall Survival (95% CI) was 22.8 (21.2 - 27.2) months.
Model Covariates
The covariates selected for inclusion in the model were Resection Margin, Tumour Grade, Lymph Nodes and (log) Post-operative CA19-9.
| N = 339 | |
|---|---|
| Tumour Differentiation Status | |
| Poor | 85 (25%) |
| Moderate | 214 (63%) |
| Well | 40 (12%) |
| Lymph Nodes | |
| Negative | 97 (29%) |
| Positive | 242 (71%) |
| log(PostOp CA19-9) | 3.04 (2.30, 4.14) |
Model
The model consturcuted was a flexible parametric survival model using a spline function to model the underlying cumulative hazard function. Five internal knots were chosen which gave sufficient flexibility. The number of knots was chosen based on the best log-likelihood.
Model Construction
The model was constructed using a backwards stepwise procedure using Akaikes Information Criterion (AIC) to evaluate model fit. Initaily, a 'null' model constructed using all covaraites, irrespective of univariable significance, was constructed and single terms removed in an itterative fashion.
Model Fit
Overall fit of the model is demonstrated by plotting the unadjusted survival estimates against the model obtained by applying the mean linear predictor.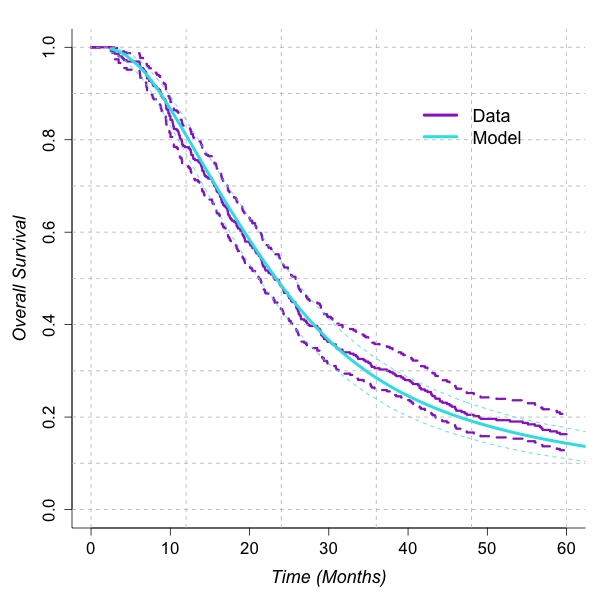
Model Estimates
| est (se) | HR (95% CI) | |
|---|---|---|
| γ0 | -11.34 (1.56) | 0 (0 - 0) |
| γ1 | 3.84 (0.79) | 46.58 (9.9 - 219.04) |
| γ2 | 1.28 (2.22) | 3.61 (0.05 - 280.98) |
| γ3 | -1.28 (3.96) | 0.28 (0 - 658.74) |
| γ4 | 1.1 (3.55) | 3.02 (0 - 3139.81) |
| γ5 | -0.96 (2.22) | 0.38 (0 - 29.45) |
| γ6 | 0.4 (0.81) | 1.5 (0.31 - 7.32) |
| Lymph Nodes: Positive Vs Negative | 0.51 (0.15) | 1.66 (1.24 - 2.23) |
| Tumour Differentiation Status: Moderate Vs Poor | -0.41 (0.14) | 0.66 (0.5 - 0.87) |
| Tumour Differentiation Status: Well Vs Poor | -0.57 (0.22) | 0.57 (0.37 - 0.88) |
| log(Post-Operative CA19-9) | 0.27 (0.04) | 1.31 (1.21 - 1.41) |
Model Prediction
See how this model can be used to predict survival!Validation
Validation Details
Internal Validation
Internal validation is performed by assessing how well the model performs on the
training dataset. Validation are reported in terms of Calibration, Discrimination and Somers' D.
Calibration is reported in terms of the Mallows C-Statistic and by regressing
the fitted linear predictor against the outcome (Slope).
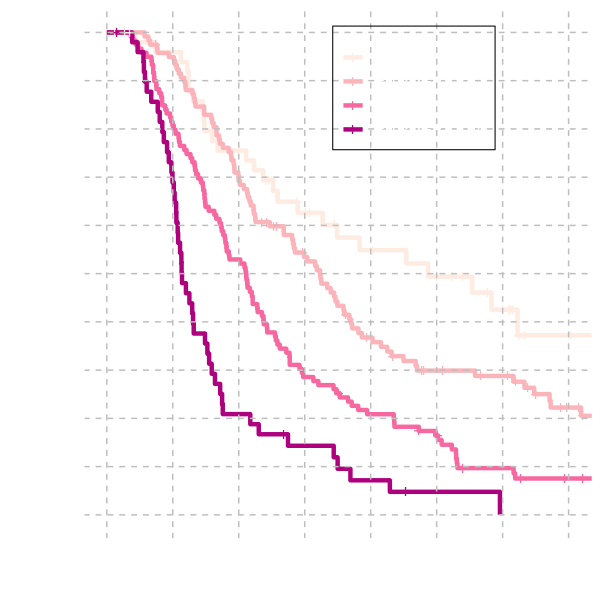
Discrimination is evaluated by categorising patients into 4 risk groups.
Risk groups are determined by the 15th, 50th and 85th centiles of the linear predictor and
compared graphically and by evaluating the relative risk by fitting a
univariable Cox Proportional Hazards Model.
Calibration
| est (se) | |
|---|---|
| C-Statistic | 0.64 (0.017) |
| Slope | 0.999 (0.11) |
| Somers' D | 0.28 |
Discrimination
| est (se) | HR (95% CI) | |
|---|---|---|
| Risk Group 1 | ||
| Risk Group 2 | 0.40 (0.22) | 1.50 (0.96, 2.32) |
| Risk Group 3 | 0.96 (0.22) | 2.62 (1.71, 4.03) |
| Risk Group 4 | 1.67 (0.25) | 5.30 (3.25, 8.64) |
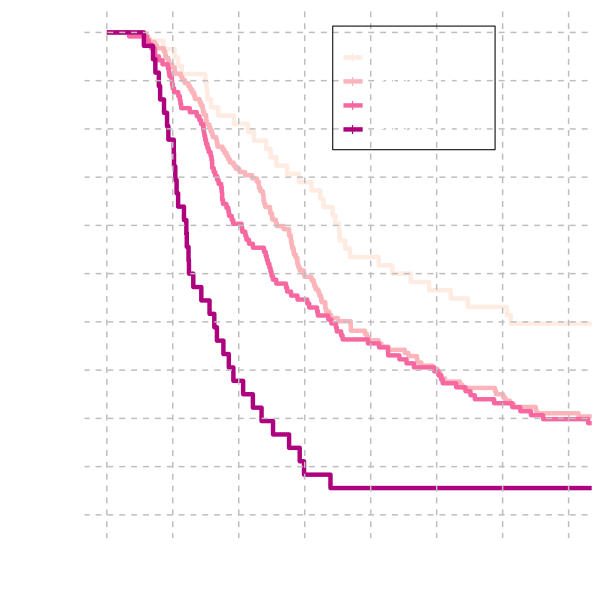
External Validation
The model is validated on an external dataset of GEM treated patients
that took part in the ESPAC-4 study as well as the ESPAC-3 study that
was used to build the model.
The patients were categorised into 4 risk groups determined by the same
quantiles used for internal validation.
Calibration
| est (se) | |
|---|---|
| C-Statistic | 0.60 (0.018) |
| Slope | 0.63 (0.13) |
| Somers' D | 0.19 |
Discrimination
| est (se) | HR (95% CI) | |
|---|---|---|
| Risk Group 2 | 0.37 (0.18) | 1.46 (1.02-2.08) |
| Risk Group 3 | 0.46 (0.19) | 1.59 (1.11-2.30) |
| Risk Group 4 | 1.44 (0.24) | 4.22 (2.66-6.71) |
Use this model
This model is available to download
Find out more about how models are stored/shared and how you can use them
This model has been used to compare the combined therapy GemCap against Gem.
References
Details on the trial which provided the data for this model can be found at:
Neoptolemos JP, Stocken DD, Bassi C, et al. Adjuvant Chemotherapy With
Fluorouracil Plus Folinic Acid vs Gemcitabine Following Pancreatic Cancer
Resection: A Randomized Controlled Trial. JAMA. 2010;304(10):1073–1081.
doi:10.1001/jama.2010.1275