The observed survival outcome of patients treated with gemcitabine plus capecitabine (GEMCAP) (experimental treatment) were compared against the predicted response of monotherapy gemcitabine (GEM) (control treatment). A counterfactual model (CFM) is used to estimate the expected response of patients had they been treated with GEM.
Data
Data cohort for comparison against the CFM
Observed patient data, to compare against the CFM, were taken from the European Study Group for PAncreatic Cancer (ESPAC-4) Study- A randomised controlled phase III trial that compared the effect of adjuvant combination chemotherapy of gemcitabine and capecitabine (GEMCAP) versus monotherapy gemcitabine (GEM) in patients with resected pancreatic ductal adenocarcinoma.
Patients
The ESPAC-4 dataset consisted of 732 patients in total. Only patients that had been treated with GEMCAP were included as part of the data cohort for comparison, resulting in a total of 362 patients.
Intervention
GEMCAP patients received GEM 1000mg/m2 and oral CAP 1660 mg/m2/day
Comparison
Patients were treated with either GEM or adjuvant GEMCAP combination therapy
Description of model
Gemcitabine CFM
The GEM CFM model (developed on the ESPAC-3 data) was used to generate counterfactual evidence had the ESPAC-4 data cohort been treated with GEM. The actual observed response of patients treated with GEMCAP were then compared against the model's expected response of the data cohort.
The GEM model and the details of the data used to build the model can be found here
Analysis
A counterfactual model and a data cohort were used to make a comparison of treatment efficacy.
GEM Vs GEMCAP
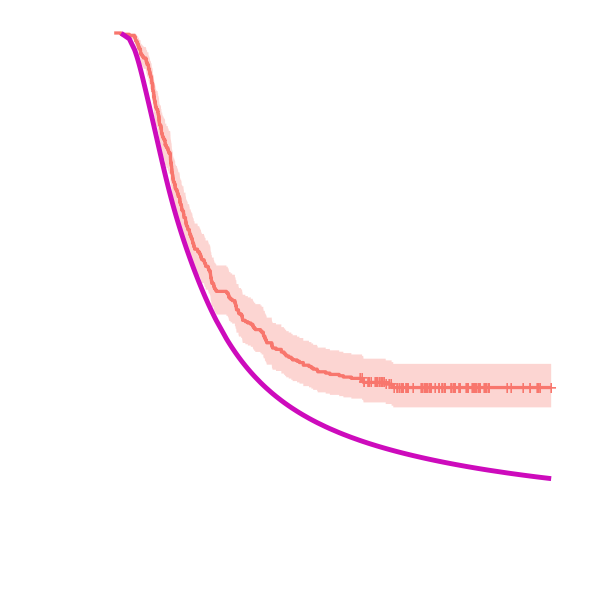
The average expected survival estimate of the CFM (control treatment- GEM) and the average observed survival estimate of the GEMCAP patients is shown below to visualise the comparison of GEM treatment (pink) vs GEMCAP treatment (orange).
Estimates of the efficacy parameter for the overall comparison of GEM Vs GEMCAP
The efficacy parameter (β) measures the distance between the observed data and the model's estimate. Here, a median value (2.5%, 97.5% quantiles) of -0.47 (-0.60,-0.34) is obtained for β
| Median | 2.5% | 97.5% | |
|---|---|---|---|
| β | -0.47 | -0.60 | -0.34 |
| DIC | 1321.34 | 1297.85 | 1356.92 |
DIC, deviance information criterion.
The predicted survival probability for ESPAC-4 patients treated with GEM is less than the observed survival probability of ESPAC-4 patients treated with GEMCAP, demonstrating that combination therapy GEMCAP has greater efficacy than monotherapy GEM. The survival estimates are obtained by multiplying the cumulative baseline hazard function by the mean of the linear predictor.
Sub-group analysis
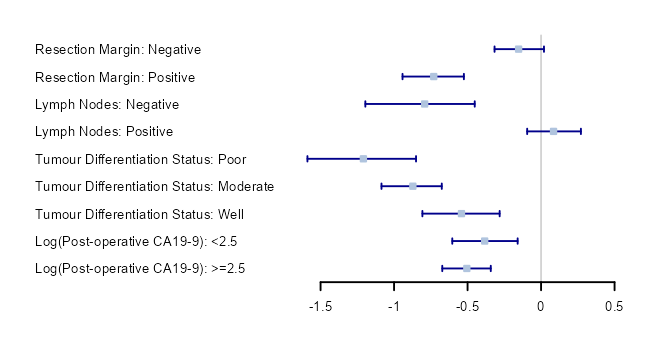
Treatment efficacy can be compared within individual sub-groups. The estimated efficacy parameters (β) (95% confidence intervals) are visualised using forest plots. The results of the sub-group analyses show that survival estimates differ between sub-groups. For example the negative resection margin group has a higher observed estimated treatment efficacy than the positive resection margin group.
Conclusions
CFMs can be used to predict and compare patient level outcomes.
In this example, we used a data-cohort of patients that
were treated with an experimental treatment and a CFM that was used
to predict the survival of the same data-cohort when treatead with
GEM (a control). The GEM CFM survival predictions were compared with
the actual outcome of the GEM treatment.
The comparison showed that GEMCAP was the more effective treatment.
Sub-group effects can be looked at by only including patients within a certain group in the data cohort.
References
Details on the ESPAC-4 trial from which the data cohort were taken from can be found at:
Neoptolemos, J.P. et al. (2017) ‘Comparison of adjuvant gemcitabine and
capecitabine with gemcitabine monotherapy in patients with resected
pancreatic cancer (ESPAC-4): a multicentre, open-label,
randomised, phase 3 trial’, The Lancet (British edition),
389(10073), pp. 1011–1024.
Details on the gem model can be found here